Building a Data Pipeline for Business Insights 🚀- Project
In this project, I will go over how I architected, designed and implemented a scalable AWS data pipeline to extract and analyze a cafe's clickstream data. This solution provided actionable insights, enabling the cafe owner to make informed investment decisions and drive significant sales growth.
Generative AI as my Co-pilot
I used Generative AI as a co-pilot to create a clear, concise dashboard in AWS. The dashboard provided fresh insights, enabling our business client to implement scalable revenue-boosting improvements while reducing security risks and minimizing data noise.

CloudWatch Dashboard with Custom section headers for better ux
Read on for the Case study or you can watch this project by clicking the link below!
Let’s start with the Business NEED
Business Problem: A globally known Café sells dessert and coffee items through their website and has multiple cafés globally. They aim to gain insights into customer interactions on their website to make data-driven decisions for better business outcomes.
Pain Points Identified:
1. Lack of Customer Insights: Difficulty in understanding customer behavior on the website.
2. Inefficient Marketing: Inability to target marketing efforts effectively due to insufficient data.
3. Operational Inefficiencies: Challenges in streamlining café operations without data-driven insights.
4. Expansion Uncertainty: Lack of actionable data to decide on new café locations.
The Solution:
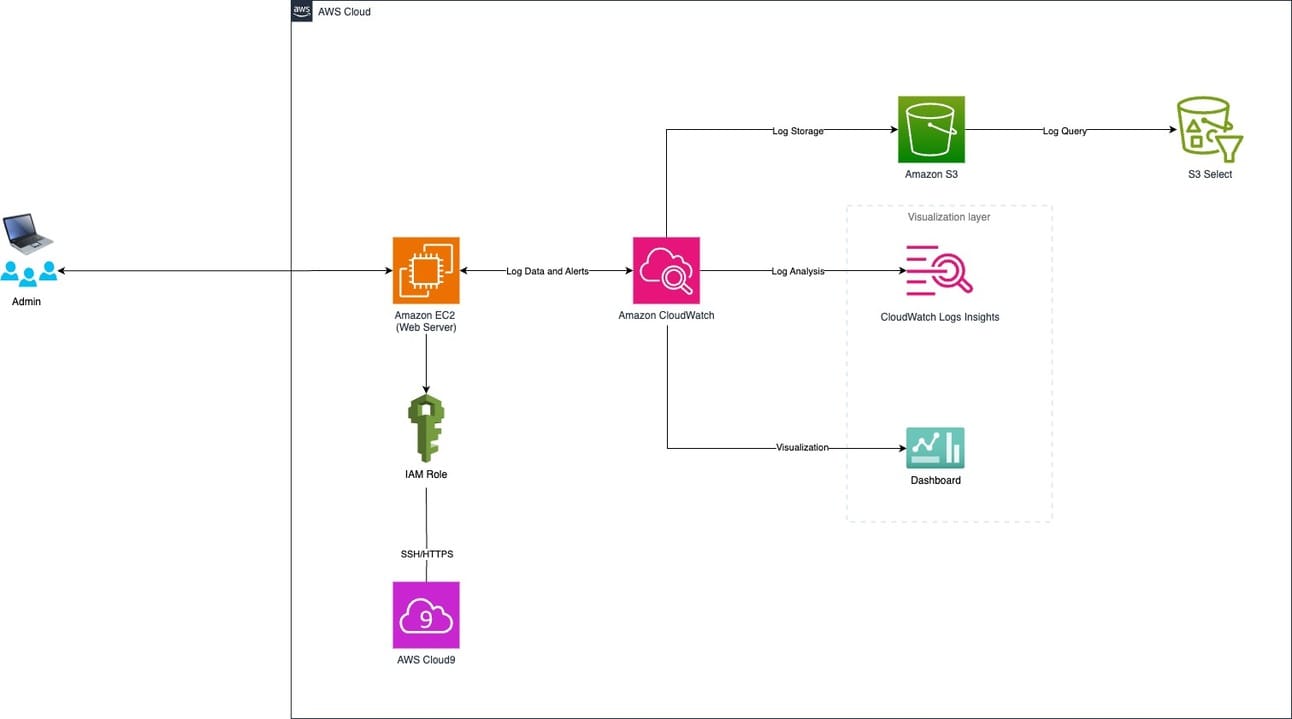
I designed and implemented a data analytics pipeline using AWS services to capture, store, and analyze clickstream data from AnyCompany Café’s website. This solution provides real-time insights into customer behavior to inform business decisions, improve usability, and boost conversion rates.
Implementation of AWS Services:
Amazon EC2: For hosting the web server.
Amazon CloudWatch: For logging, monitoring, and dashboarding.
Amazon S3 & S3 Select: For data storage and querying using S3 Select.
AWS Cloud9: For development and management environment.
IAM Role: For secure access and permissions management.
Proposed Architecture:

Building a Data Pipeline to Support Analyzing Clickstream Data with AWS
Costs
The project required that I price the solution along with the architecture and the dashboard. AWS Cost Calculator is one of my favorite tools when working on Architecture projects. Money is a huge factor when migrating from legacy architecture, to a more modern cloud, such as Amazon Web Services.
Here is a snapshot of the costs:

AWS Pricing calculator helps retain costs when implementing your Cloud solution.
Details matter, so below is my cost process along with business impacts of each cost. My strategy is always to view the business impacts of any architecture and solution that I suggest.
Step 1: Create Estimate
1. Description: AnyCompany Café Data Pipeline
* Why: Provides a clear identifier for the purpose of the EC2 instance, aiding in tracking and management.
* Business Impact: Helps in easy identification and management of the EC2 resources specific to the data pipeline, ensuring organized resource handling.
2. Choose a Location Type: Region
* Why: Selecting a specific region helps in optimizing latency and compliance with local regulations.
* Business Impact: Ensures the data pipeline operates efficiently with minimal latency, providing quick insights from clickstream data, enhancing user experience.
3. Choose a Region: US East (Ohio)
* Why: Typically one of the more cost-effective and widely used regions with good latency for most parts of the US.
* Business Impact: Cost savings due to lower regional pricing while maintaining good performance for users accessing the website and data.
Step 2: Configure Service
EC2 Specifications
1. Tenancy: Shared Instances
* Why: Shared tenancy is more cost-effective as it shares the underlying hardware with other AWS customers.
* Business Impact: Reduces costs significantly compared to dedicated instances, making the solution more affordable for AnyCompany Café.
2. Operating System: Linux
* Why: Linux is an open-source operating system that is widely supported, cost-effective, and suitable for web servers and data processing.
* Business Impact: Cost savings from not requiring Windows licensing, and reliability for running the data pipeline.
3. Workloads: Consistent usage
* Why: The pipeline will be running continuously to process clickstream data, which means consistent resource usage.
* Business Impact: Ensures the instance type chosen is optimized for continuous operation, leading to stable performance and predictable costs.
4. Number of Instances: 1
* Why: Starting with a single instance is sufficient to handle the initial workload; more instances can be added if needed.
* Business Impact: Minimizes initial costs while providing the necessary computational resources to handle clickstream data.
EC2 Instances (714)
1. Instance Type: t4g.nano
* Why: Provides a balance of cost and performance, suitable for lightweight processing tasks.
* Business Impact: Keeps costs low while providing enough processing power for the data pipeline's needs.
* vCPUs: 2
* Why: Sufficient for the processing load of a small to medium-sized data pipeline.
* Business Impact: Ensures smooth operation without over-provisioning resources, optimizing costs.
* Memory: 0.5 GiB
* Why: Adequate for handling the data processing tasks of the pipeline.
* Business Impact: Keeps costs low while meeting the memory requirements of the application.
* Network Performance: Up to 5 Gigabit
* Why: Ensures that the instance can handle the data throughput required for processing clickstream logs.
* Business Impact: Provides sufficient bandwidth for data transfer, ensuring timely processing and analysis of clickstream data.
* On-Demand Hourly Cost: $0.0042
* Why: On-demand pricing provides flexibility and cost efficiency for variable workloads.
* Business Impact: Allows AnyCompany Café to scale usage up or down without long-term commitments, optimizing costs.
Estimated Cost Calculation
* Upfront Cost: $0.00
* Monthly Cost: $1.31
* Instance: $0.0042/Hour
* Monthly: $3.07/Month
* Annual Cost: $1.31 x 12 = $15.72
Overall Business Impact:
* Cost Efficiency:
The configuration ensures that the data pipeline runs efficiently while minimizing costs.
* Scalability:
Allows for scaling up resources if the data processing needs increase, ensuring the pipeline can grow with the business.
* Reliability:
Ensures reliable operation of the data pipeline, providing continuous insights into customer behavior.
S3 Pricing and Costing
Step-by-Step S3 Pricing Configuration with Justifications
Description
* Value: AnyCompany Café Data Pipeline
* Why: This description clearly identifies the purpose of the S3 usage, making it easier to manage and track resources.
* Business Impact: Helps in organizing and managing resources efficiently, ensuring clarity in billing and usage reports.
Choose a Region
* Value: US East (Ohio)
* Why: Keeping the region consistent with other services to reduce latency and potential data transfer costs.
* Business Impact: Ensures low latency and cost-effective data transfer between services, improving overall performance and reducing costs.
S3 Standard Storage
* Value: 30 GB per month
* Why: Based on the estimated amount of log data to be stored. S3 Standard offers high durability and availability.
* Business Impact: Ensures that critical log data is stored securely and is always available for analysis, which is essential for reliable business operations.
PUT, COPY, POST, LIST Requests
* Value: 500 requests per month
* Why: Estimate based on the expected number of operations performed on the stored data.
* Business Impact: Accounts for the cost associated with storing and managing log data, ensuring budget accuracy and resource availability.
GET, SELECT, and Other Requests
* Value: 1000 requests per month
* Why: Estimate based on the expected number of data retrieval operations for analysis.
* Business Impact: Ensures sufficient budget for data access and analysis, enabling effective business insights and decision-making.
Data Returned by S3 Select
* Value: 10 GB per month
* Why: Based on the estimated amount of data retrieved using S3 Select for detailed analysis.
* Business Impact: Enables cost-effective querying and retrieval of specific data subsets, enhancing data analysis capabilities.
Data Scanned by S3 Select
* Value: 20 GB per month
* Why: Estimate based on the amount of data scanned for S3 Select queries.
* Business Impact: Ensures budget allocation for efficient data querying and analysis, improving the ability to derive actionable insights from the data.
Inbound Data Transfer
* Value: 0 GB per month
* Why: Assume no additional inbound data transfer as data is generated within the AWS environment.
* Business Impact: No additional cost for inbound data transfer, optimizing the budget.
Outbound Data Transfer
* Value: 5 GB per month
* Why: Estimated amount of data to be transferred out of S3 for analysis or other purposes.
* Business Impact: Ensures budget allocation for outbound data transfer, preventing unexpected costs and ensuring smooth data operations.
Summary of findings
Confirmed Costed Resources:
1. Amazon EC2 (for AWS Cloud9 Environment)
* Monthly Cost: $2.19
* Annual Cost: $26.28
2. Amazon CloudWatch
* Metrics Cost (Monthly): $3.00
* API Requests Cost (Monthly): $0.00
* Logs Ingested and Storage Cost (Monthly): $1.26
* Logs Insights Cost (Monthly): $0.15
* Dashboards and Alarms Cost (Monthly): $1.00
* Total Monthly Cost: $5.41
* Total Annual Cost: $64.92
3. Amazon S3
* Standard Storage (30 GB per month): $0.69 (assuming $0.023 per GB)
* PUT, COPY, POST, LIST Requests (500 requests per month): $0.005 (assuming $0.000005 per request)
* GET, SELECT, and Other Requests (1000 requests per month): $0.004 (assuming $0.000004 per request)
* Data Returned by S3 Select (10 GB per month): $0.30 (assuming $0.03 per GB)
* Data Scanned by S3 Select (20 GB per month): $0.20 (assuming $0.01 per GB)
* Outbound Data Transfer (5 GB per month): $0.45 (assuming $0.09 per GB)
* Total Monthly Cost: $1.64
* Total Annual Cost: $19.68
4. AWS Identity and Access Management (IAM) Role
* Cost: No direct cost, used for access management and security.
Summary of Total Costs:
* Total Monthly Cost for All Services: $2.19 (EC2) + $5.41 (CloudWatch) + $1.64 (S3) = $9.24
* Total Annual Cost for All Services: $26.28 (EC2) + $64.92 (CloudWatch) + $19.68 (S3) = $110.88
Checklist for Confirmed Resources:
* Amazon EC2 (AWS Cloud9 Environment)
* Amazon CloudWatch
* Amazon CloudWatch Logs Insights
* Amazon CloudWatch Dashboard
* AWS Identity and Access Management (IAM) Role
* Amazon S3
While this section was exhaustive, I wanted to share the customer vision and work backwards towards that solution. Costs, sets the tone for that.
Next, we can go over the logs recorded, which will help our data be streamed into our pipeline.
Why Observing Logs is Important for a Clickstream
Lets talk about Business Impact of logging:
Ensuring that the CloudWatch agent is correctly configured and operational is critical for maintaining comprehensive monitoring and logging of the web server activities. This visibility is essential for troubleshooting, performance tuning, and security audits.
Enhanced Monitoring: By capturing detailed logs in CloudWatch, businesses can better understand user interactions and application performance.
Improved Troubleshooting: Immediate access to log data aids in quickly identifying and resolving issues, reducing downtime.
Compliance and Security: Detailed logging supports compliance with data regulations and enhances security by monitoring for unusual activities.
This concludes the testing phase, confirming that the CloudWatch agent is effectively collecting and sending log data as intended.
Using the simulated log and ensuring that CloudWatch receives the entries
In this phase of the project, I replace the existing access_log with one that has simulated data.
This simulated log has many more entries than you could generate by manually browsing the website yourself. This larger dataset will help to simulate real-world log activity for a website that is accessed frequently.
After I replace the existing file with this simulated data, I restart the CloudWatch agent so that it collects the new access_log data and sends it to CloudWatch for further analysis.
Simulated logs
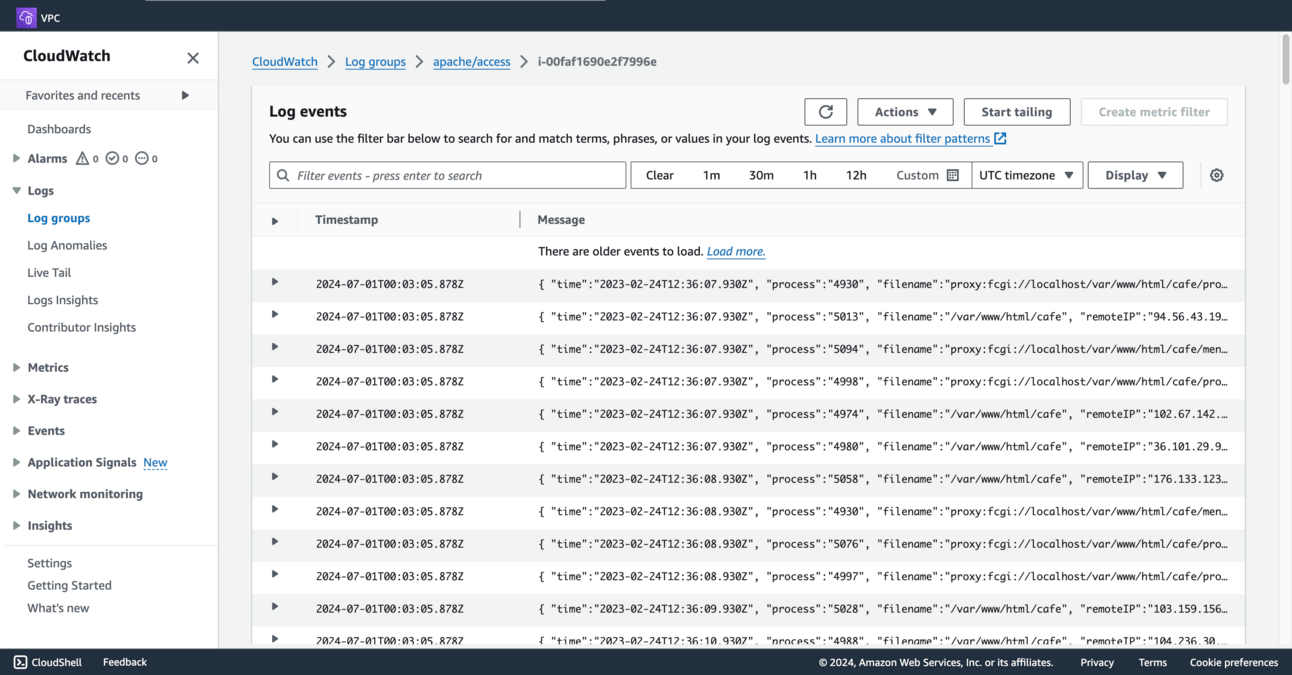
Below you will see that the new simulated log data has been successfully sent to CloudWatch and is being displayed in the log stream.

Simulated data in Cloudwatch from the apache/access log group
Dashboard walkthrough
I abbreviated many parts of this project to save you time (and scrolling). Was awesome designing, then building this solution. Check out other projects below and thanks for reading this whitepaper project.
